

![Transgender Suicide Rate [Facts & Statistics]](https://wp.bedbible.com/wp-content/uploads/2023/03/Trans-Suicide-Rate.png)
In a world where the beauty of diversity is increasingly acknowledged and celebrated, the plight of transgender individuals remains a pressing concern. This report dives deep into the statistics and stories behind one of the most sobering aspects of their experience—suicide rates within the transgender community.
Table of contents:
- Transgender suicide rate chart
- By Country
- By Age
- By Race
- By Gender
- By Education
- By Workforce Participation
- By Annual Income
- By Relationship Status
- By General Health
- Suicide rate of transgender before and after surgery
- By Religion
- By Type of Violence
Key Findings
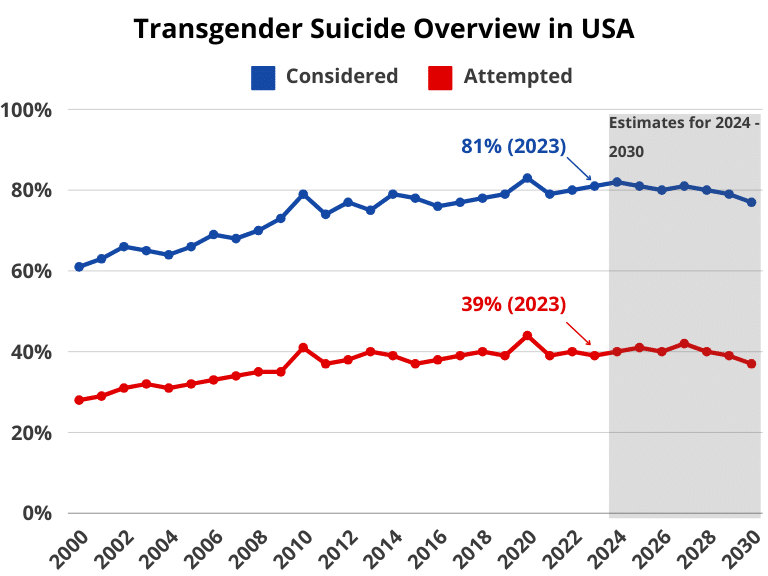
- 8 out of 10 trans have seriously considered suicide (80%).
- 4 out of 10 transgender attempts suicide (40.6%).
- 10% of the ones that attempt are completed suicides (less than 1 out of 10 transgenders that kill themselves).
- The number of completed suicides among transgenders is the same as for the normal population. It’s only the attempts that differ significantly.
- 56% of transgender youth/teens (13-24 years) have attempted suicide.
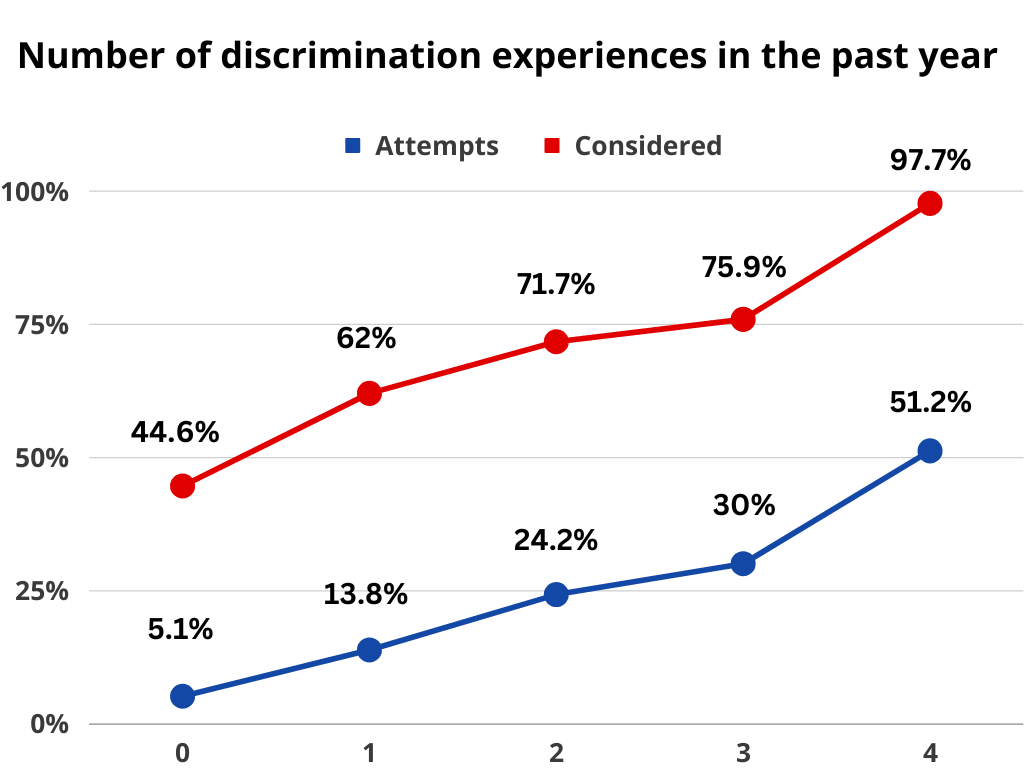
- 97% of trans people who have experienced more than three situations of discrimination think about suicide. Around 50% of them try to commit suicide.
- Native Americans are the race with the most attempts to commit suicide (57.3%). After Native Americans come biracial with 50.4%, and then Latinx with 44.5%.
- 51.8% of trans people who have less than a high school education attempt suicide – the lower their education the higher the probability of attempting suicide.
- The higher income the lower probability of committing suicide as trans. 47.3% of trans people with an annual income between $1 to $9,999 attempt suicide and only 29.6% of trans people with an income between $100,000 or more.
- 39.5% of Trans “singles” attempt suicide. That’s the highest among the different relationship statuses.
- 15% of transgenders that experience denied equal treatment have tried to kill themselves in the last year.
- 9% of the ones that got rejected by their families have tried to commit suicide in the last year.
- 29% who got attacked publicly have attempted suicide in the last 12 months.
- As many as 60% of transgender men and transgender women in Iran have made suicide attempts.
- 65% of Trans people rating their general health as “poor” attempt suicide. Where only 26.9% of people rating their health as “Excellent” attempts suicide.
- 48.4% of trans individuals living with HIV attempt suicide, whereas only 43.4% who are HIV-negative do.
- 5 out of 10 homeless trans individuals attempt suicide (Only 3 out of 10 trans individuals that have a home do that).
- 9 out of 10 transgenders that left a religious community because they got rejected consider killing themselves.
Transgender Suicide Rate Chart
- 4 out of 10 transgender have attempted to commit suicide (this is the highest rate in the LGBT community). Only 10% of attempted suicides are completed. Meaning that less than 1 out of 10 trans dies from suicide. Compared to the normal population this is very high. The suicide rate for the normal population is 13.5 out of 100,000 individuals.
By Country
- In India, an alarming 31% of transgender individuals have taken their own lives, with a staggering 50% of them attempting suicide before reaching the age of 20.
- In the United Kingdom, nearly half (47.25%) of transgender participants reported experiencing suicidal ideation, while a significant proportion (27%) of participants have attempted suicide.
- in New Zealand, one-fifth (20%) of transgender students have reported attempting suicide in the past 12 months.
- Up to 60% of transgender men and transgender women in Iran have attempted suicide.
By Age
The suicide rate among transgender youth and teens (13-24) has the highest suicide attempts compared to the rest of the trans people (52.1%). That’s more than 5 out of 10 trans teens and youth that try to commit suicide.
It’s also mentionable that the older trans individuals become the less risk of attempting suicide. This applies to persons thinking about committing suicide as well as the ones who try to kill themselves.
| Age Range | Considered suicide | Attempted Suicide |
|---|---|---|
| 13-17 | 91.3% | 62.1% |
| 18-24 | 86.3% | 42.1% |
| 25-44 | 81.8% | 42.2% |
| 45-54 | 74.4% | 37.5% |
| 55-64 | 68.4% | 28.6% |
| 65+ | 56.6% | 17.5% |
By Race
Alaska Natives and American Indians are the races that attempt to commit suicide the most (57.3%). Right after are biracial where 50.4% have attempted to commit suicide.
| Race/Ethnicity | Considered Suicide | Attempted Suicide |
|---|---|---|
| Alaska Native/American Indian | 86.8% | 57.3% |
| Asian | 81.8% | 40.3% |
| Biracial/Multiracial | 88% | 50.4% |
| Black/African American | 81.2% | 46.6% |
| Latinx/Hispanic | 84.1% | 44.5% |
| White/Caucasian | 80.8% | 37.4% |
By Gender (assigned at birth)
Men vs. women: 42.7% of transgender men (assigned girls at birth) attempt suicide. “Only” 37.2% of transgender women (assigned boys at birth) attempt suicide. This is different from the normal population where males are 3.5 times more likely to die from suicide than women.
| Gender | Considered Suicide | Attempted Suicide |
|---|---|---|
| Female | 85.5% | 42.7% |
| Male | 77.2% | 37.2% |
By Education
Higher education levels are generally associated with lower rates of both considering and attempting suicide.
Individuals with less than a high school education have the highest rates of both considering (85%) and attempting suicide (51.8%).
There is a notable decrease in the rates of considering and attempting suicide among individuals with a Bachelor’s degree or higher.
The smallest difference in suicide attempt rates is observed between individuals with some college (no degree)/Associate and those with a high school education.
The largest difference in suicide attempt rates is seen between those with less than a high school education and those with a graduate or professional degree.
| Education Level | Considered Suicide | Attempted Suicide |
|---|---|---|
| Less than high school | 85% | 51.8% |
| High school | 84.6% | 48.5% |
| Some college (no degree)/Associate’s | 84.9% | 44.1% |
| Bachelor’s degree | 78.6% | 33.7% |
| Graduate or professional degree | 72.1% | 30% |
By Workforce Participation
Unemployed individuals have the highest rates of both considering (87.1%) and attempting suicide (46.4%).
Employed individuals have the lowest rates of considering (80.6%) and attempting suicide (38.4%) among the three groups.
The difference in suicide attempt rates between employed and unemployed individuals is notable, with unemployed individuals showing an 8% higher rate.
Although individuals out of the labor force have a slightly higher rate of considering suicide (81.7%) compared to those who are employed, their attempted suicide rate (42.9%) is notably higher than that of the employed group.
Employment status appears to have a significant impact on both considering and attempting suicide, with unemployment being a major risk factor.
| Employment Status | Considered Suicide | Attempted Suicide |
|---|---|---|
| Employed | 80.6% | 38.4% |
| Unemployed | 87.1% | 46.4% |
| Out of the labor force | 81.7% | 42.9 |
By Annual Income
Lower annual income levels are generally associated with higher rates of both considering and attempting suicide.
Individuals with an annual income of $1 to $9,999 and $10,000 to $19,999 show the highest rates of considering suicide, at 85.5% and 86.7%, respectively.
The highest rate of attempted suicide (48.5%) is observed among those with an annual income of $10,000 to $19,999.
As the annual income level increases, the rates of considering and attempting suicide consistently decrease, with the lowest rates found in the $100,000 or more income category (74% for considered and 29.6% for attempted suicide).
There is a substantial difference in attempted suicide rates between the lowest and highest income groups, highlighting the significant impact of financial stability on mental health and suicide risk.
| Annual Income | Considered Suicide | Attempted Suicide |
|---|---|---|
| $1 to $9,999 | 85.5% | 47.3% |
| $10,000 to $19,999 | 86.7% | 48.5% |
| $20,000 to $49,999 | 84.2% | 42.9% |
| $50,000 to $100,000 | 78.8% | 36.2% |
| $100,000 or more | 74% | 29.6% |
By Relationship Status
The highest rates of considering (85.5%) and attempting suicide (43.5%) are found among individuals who are partnered but not living together.
The lowest rates of considering (79.3%) and attempting suicide (40%) occur among individuals who are partnered and living together.
Single individuals and those in the “not listed above” category exhibit relatively similar rates of considering and attempting suicide, indicating a lesser impact of relationship status on suicide risk for these groups.
The difference in suicide attempt rates between partnered individuals living together and those not living together is significant, with a 3.5% higher rate among those not living together.
Relationship status seems to influence suicide risk, with the stability and support provided by living with a partner potentially serving as a protective factor.
| Relationship Status | Considered Suicide | Attempted Suicide |
|---|---|---|
| Partnered, living together | 79.3% | 40% |
| Partnered, not living together | 85.5% | 43.5% |
| Single | 81.9% | 39.5% |
| Not listed above | 83% | 40.8% |
By General Health
Individuals with serious psychological distress, a history of heavy alcohol use, illicit drug use (excluding marijuana), poorer general health, disabilities, homelessness, or a recent arrest have higher rates of both considering and attempting suicide compared to their counterparts without these characteristics.
The highest rate of attempted suicide (65%) is observed among individuals with poor general health, while the lowest rate (26.9%) is found among those with excellent general health.
People who are homeless or have been arrested in the past year have notably higher rates of attempted suicide (59.3% and 58.1%, respectively) compared to those who have not experienced homelessness or arrest.
Individuals living with HIV show a lower rate of considering suicide (72.6%) compared to those who are HIV-negative (82%) or don’t know their status (81.7%), but they have a higher rate of attempted suicide (48.4%).
The presence of a disability, whether defined by the ACS or self-identified, is associated with significantly higher rates of considering and attempting suicide compared to those without a disability.
| Characteristic | Considered Suicide | Attempted Suicide |
|---|---|---|
| Serious psychological distress | ||
| No | 73.8% | 31.5% |
| Yes | 94.3% | 54.2% |
| Heavy alcohol use | ||
| No | 81.4% | 39.5% |
| Yes | 85.2% | 50.3% |
| Illicit drug use (excluding marijuana) | ||
| No | 81% | 39.1% |
| Yes | 88.6% | 52.9% |
| General Health | ||
| Excellent | 66.9% | 26.9% |
| Very good | 77.6% | 33.9% |
| Good | 84.8% | 42.1% |
| Fair | 90.3% | 52.3% |
| Poor | 95.8% | 65% |
| HIV status | ||
| Living with HIV | 72.6% | 48.4% |
| HIV negative | 82% | 43.4% |
| Don’t know status | 81.7% | 36.8% |
| Disability (ACS) | ||
| No | 75.7% | 32% |
| Yes | 91.2% | 53% |
| Disability (self-identify) | ||
| No | 78.2% | 35% |
| Yes | 90.9% | 54.5% |
| Homelessness | ||
| No | 77.7% | 32.2% |
| Yes | 91% | 59.3% |
| Arrested for any reason (past year) | ||
| No | 81.6% | 40.1% |
| Yes | 88.1% | 58.1% |
Suicide rate of transgender before and after surgery
Individuals currently taking hormones show slightly higher rates of considering (82.1%) and attempting suicide (42.6%) compared to those not taking hormones (79.2% and 40.8%).
Higher attempted suicide rates are observed among people obtaining hormones from a mix of licensed professionals and friends/others (51.4%) or solely from friends/others (52%) compared to those acquiring hormones exclusively from licensed professionals (41.6%).
Similar rates of considering and attempting suicide are found between individuals wanting hormones but not having had them, and those wanting and having had hormones.
Post-op individuals, who want and have had surgery, exhibit slightly lower rates of considering (79.0%) and attempting suicide (39.5%) than those who want but have not undergone surgery (83.9% and 41.5%).
��“De-transitioned” individuals demonstrate higher rates of considering (86%) and attempting suicide (52.5%) compared to those who have not de-transitioned (81.6% and 41.8%).
| Characteristic | Considered Suicide | Attempted Suicide |
|---|---|---|
| Currently taking hormones | ||
| No | 79.2% | 40.8% |
| Yes | 82.1% | 42.6% |
| Where get hormones | ||
| Only licensed professionals | 81.7% | 41.6% |
| Professionals and friends/other | 87% | 51.4% |
| Only friends/other | 81.7% | 52% |
| Had/have hormones | ||
| Want them, haven’t had | 84.4% | 41.1% |
| Want them, have had | 81.9% | 42.4% |
| Had/have surgery | ||
| Want, have not had | 83.9% | 41.5% |
| Want, have had | 79.0% | 39.5% |
| Ever “de-transitioned” | ||
| No | 81.6% | 41.8% |
| Yes | 86% | 52.5% |
By Religion
Individuals who have ever been part of a religious community show slightly higher rates of considering (82.2%) and attempting suicide (41.3%) compared to those who have not been part of one (80.7% and 38.6%).
A significantly higher rate of attempted suicide (60.4%) is observed among individuals who left a religious community due to rejection compared to those who did not leave for this reason (36.8%).
Both individuals who found an accepting religious community (88.1% and 60%) and those who did not (92.6% and 60.8%) show notably high rates of considering and attempting suicide, with only a slight difference between the two groups.
| Characteristic | Considered Suicide | Attempted Suicide |
|---|---|---|
| The left religious community rejected | ||
| No | 80.7% | 38.6% |
| Yes | 82.2% | 41.3% |
| Left religious community rejected | ||
| No | 80.2% | 36.8% |
| Yes | 90.8% | 60.4% |
| Found accepting religious community | ||
| No | 92.6% | 60.8% |
| Yes | 88.1% | 60% |
By Type of Violence
Individuals who have been physically attacked for any reason in the past year show significantly higher rates of considering (92.4%) and attempting suicide (64.9%) compared to those who have not been attacked (80.1% and 36.7%).
The rates of considering (93.8%) and attempting suicide (69.2%) are notably higher among individuals who have been physically attacked specifically because they are transgender in the past year compared to those who have not been attacked for this reason (80.5% and 37.7%).
Individuals who have experienced unwanted sexual contact at any point in their lives exhibit considerably higher rates of considering (89.7%) and attempting suicide (53.6%) compared to those who have not experienced such contact (74.7% and 28.7%).
| Characteristic | Considered Suicide | Attempted Suicide |
|---|---|---|
| Physically attacked, any reason (past year) | ||
| No | 80.1% | 36.7% |
| Yes | 92.4% | 64.9% |
| Physically attacked because trans (past year) | ||
| No | 80.5% | 37.7% |
| Yes | 93.8% | 69.2% |
| Unwanted sexual contact (ever) | ||
| No | 74.7% | 28.7% |
| Yes | 89.7% | 53.6% |